|
Pi is one of those constants in the mathematical world. And because of that, it often appears in nature, particularly any that involves curves and spirals. But it would be too easy to derive pi from those very things - they are ordered, unchanging, predictable.
But what if pi can be derived from a series of improbable, unpredictable actions? |
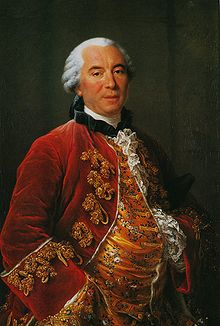
"Suppose we have a floor made of parallel strips of wood, each the same width, and we drop a needle onto the floor. What is the probability that the needle will lie across a line between two strips?"
Georges-Louis Leclerc - Comte de Buffon, 'Histoire Naturelle, Générale et Particulière' (1777)
|
Children all over the world (and no doubt many grownups, too) play at "lines and squares", attempting to avoid stepping on the joints or cracks between the panels of pavement in the sidewalk. In this note, we will explore a randomized, mathematical version of the game. The idea was first raised by Georges Louis Leclerc, Comte de Buffon in his paper, Sur le jeu de franc-carreau, published in 1777.
Buffon first considered the case of a small coin ("un ecu") thrown at random on a floor tiled with congruent squares. It was apparently then all the rage to bet as to whether the coin would land entirely within the boundaries of a single tile ("à franc-carreau"), or would land across one of the boundaries between two adjacent tiles. Buffon was apparently the first to realize that the fair odds for such a wager could readily be determined by noting that the coin would land entirely within a square tile whenever the center of the coin landed within a smaller square, whose side was equal to the side of a floor tile less the diameter of the coin. Clearly, the probability that the coin lands wholly within a single tile is simply the ratio of the area of the tile to the area of the square contained within the dashed lines, as the center of the coin is equally likely to land in any two regions of equal area, or, more generally, the probability that the center of the coin lands in one of two regions equals the ratio of the areas of the two regions. This seems to have been the beginning of the study of "geometric probability," where probabilities are determined by comparison of measurements, rather than by identifying and counting alternative, equally probable discreet events, such as specific hands of cards, or rolls of dice. |
Buffon then raises the question of a more interesting case -- suppose one throws, not a circular object, but an object of a more complex shape, such as a square, a needle, or a "baguette" (a rod or stick). He treats in detail the famous "Needle Problem": Suppose a needle is thrown at random on a floor marked with equidistant parallel lines. What is the probability that the needle will land on one of the lines?
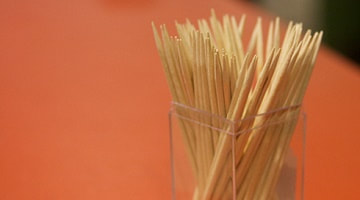
Ever helpful, Buffon points out that "On peut jouer ce jeu sur un damier avec une aiguille à coudre ou une épingle sans tête." (You can play this game on a checkerboard with a sewing-needle or a pin without a head.)
Ever helpful, Buffon points out that "On peut jouer ce jeu sur un damier avec une aiguille à coudre ou une épingle sans tête." (You can play this game on a checkerboard with a sewing-needle or a pin without a head.)
|
It is instructive to start with a simpler problem: what is the probability that a disk of diameter d will land on one of the lines, where the lines are separated by a distance h?
As in the case of square tiles, it can be seen by inspection that the disk will land between the lines whenever the center of the disk lands in a band of width h - d. Thus, the probability that a disk of diameter d lands between the lines is ( h - d ) / h, and the probability that the disk lands on a line is simply d/h. Now consider the case of the needle thrown on the floor ruled with equidistant parallel lines. For simplicity, suppose that the length of the needle is equal to the spacing, h, between adjacent lines. For a moment, let's restrict our attention to those throws when the needle falls perpendicular to the lines on the floor. In this case, the needle acts just like a disk of diameter h as in the previous example -- the probability that the needle crosses a line is h / h = 1. Similary, if the needle falls parallel to the ruled lines, the probability that it crosses a line is zero. |
|
|
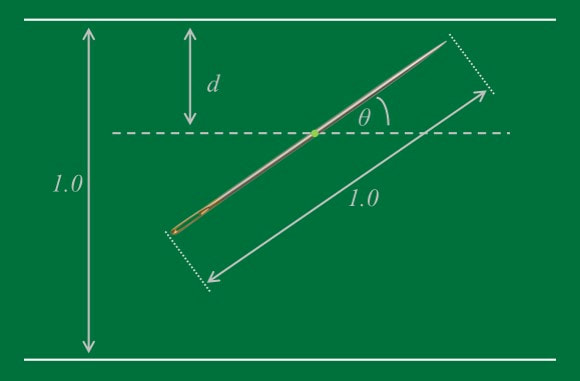
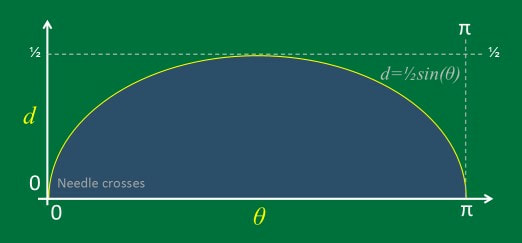
Now consider the case of a needle which falls so as to make an angle, θ, with the parallel lines on the floor. Then reference to the figure confirms that in this case, the needle has an effective "height" of h sin θ, and so the probability that the needle in this orientation will cross a line is h sin θ / h = sin θ. Of course, this formula includes the special cases noted above where the needle falls perpendicular or parallel to the lines on the floor.
In order to determine the overall probability that the needle lands on a line, we must account for the probability of each possible orientation of the needle, and then apply our formula for the probability that the needle, in that orientation, lands so as to cross a line on the floor. This sort of calculation is an application of the notion of "conditional probability". |
Buffon discovered that if you draw a set of equally-spaced parallel lines (say, d centimetres apart) and drop sticks on them which are shorter than the spacing (say l centimetres long, where l is less than d), then the probability of a stick crossing a line is: 2l/πd
This means that if you drop lots of sticks randomly and count how many cross the parallel lines, you can calculate what π is by rearranging the formula: π = 2ls/cd
where s is the number of sticks you drop and c is the number that crossed a line.
Isn’t that remarkable? Buffon had worked out that you can calculate π just by dropping a bunch of sticks on a table — no circles required! The problem is known as Buffon’s Needle.
As usual in statistics, we want to take a big sample to get an estimate close to the true probability. If I ask 5 people ‘are you left handed?’ and you ask 500 people the same, we know that your bigger sample is likely to give us the better idea of what proportion of people are left handed in the whole country. The same applies here — to get a good sample we need to drop a lot of sticks.
Perhaps that’s why it took a long time after Buffon’s discovery for somebody to actually try it themselves, but in 1901 the Italian mathematician Mario Lazzerini gave it a go. He span around and dropped over 3,400 sticks onto the floor, counted up the number that crossed over lines and estimated π to be 3.1415929. We know π to be 3.1415927…, so he was correct in the first 6 digits, an error of 0.000006%. That’s good! Suspiciously good in fact, and so improbable that it’s more likely he cheated.
Simulations have become vastly easier and more important now that we can use computers to do the legwork for us. I’m sure a dizzy Lazzerini would’ve appreciated one. Simulations like this, where we use randomness (or, usually, pseudo-randomness) to give us a sample of results, are called Monte Carlo methods, after the European city famous for its casino.
Monte Carlo methods are very useful in physics, as we can model a large system with a huge number of possible states with a much smaller, but representative subset. It has important uses in thermal physics, molecular modelling, astrophysics and weather forecasting. And, as Buffon showed 200 years ago, can even be used to calculate π.
Ponder this
Would the estimate be more or less accurate if the needle is shortened or lengthened?
What if instead of a needle (which have equidistant length from its center, creating a circle), we use a square (which length between its perimeter and center varies) instead?
Discuss
Try repeating the experiment in class. Group the students into teams and have them compete with each other in estimating pi.
Further readings
Georges-Louis Leclerc, Comte de Buffon, on the discoverer
Buffon's Needle Problem, at Wolfram Mathworld, for a more technical explanation on how it works.
3D Physical Simulation of Buffon's Needle, by Jeffrey Ventrella